Published
- 1 min read
Prototyping project: Energy Grid Dashboard
Prototyping project: Energy Grid Dashboard
React + TypeScript + Tailwind CSS dashboard showcasing energy storage monitoring capabilities with D3.js visualizations.
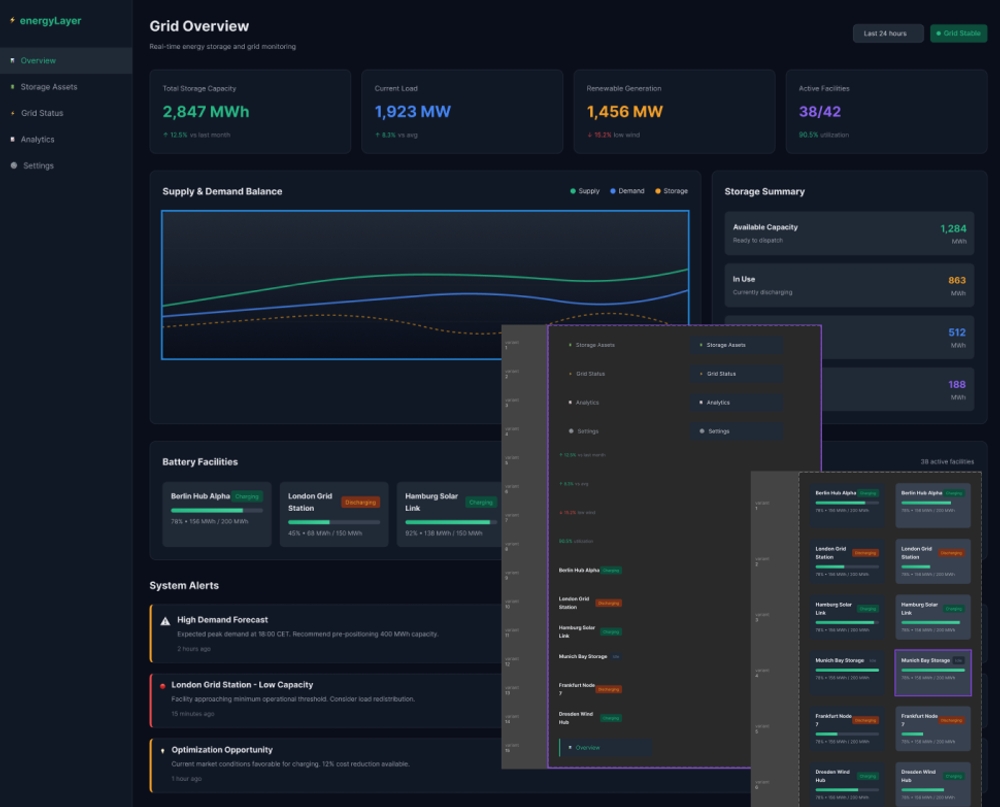
Project Overview
I wanted to understand what could be achieved for energy storage monitoring with a focused prototyping project. Mockups in figma helped explore layout and visual hierarchy, while the React + TypeScript codebase allowed me to build interactive components and D3.js visualizations.
Visual Components
Energy Dashboard Components

Energy Dashboard Variants

Demo url: https://energy-dashboard-inky.vercel.app/
Git repo: https://github.com/mykotypes/energy
The dashboard showcases:
- D3.js interactive visualizations
- React + TypeScript architecture
- Responsive Tailwind CSS design
- Domain-specific understanding of energy storage
Design Rationale Summary
This dashboard balances information density with usability. Rather than showing every possible metric, it focuses on what operators need for decision-making:
- Is the grid stable? (Status badge)
- What’s the trend? (Supply/demand chart)
- Where is capacity allocated? (Storage summary + battery grid)
- What needs attention? (Alerts)
The visual hierarchy guides the eye naturally through this decision tree, while the color system provides instant cognitive shortcuts (green = good, red = urgent).
Possible next steps
- Click battery cards to see detailed facility view
- Add WebSocket simulation for real-time updates
- Implement search/filter for battery facilities