Published
- 4 min read
Coffee Reach: a Mapbox prototype for telling a walk as a story
Coffee Reach: a Mapbox prototype for telling a walk as a story
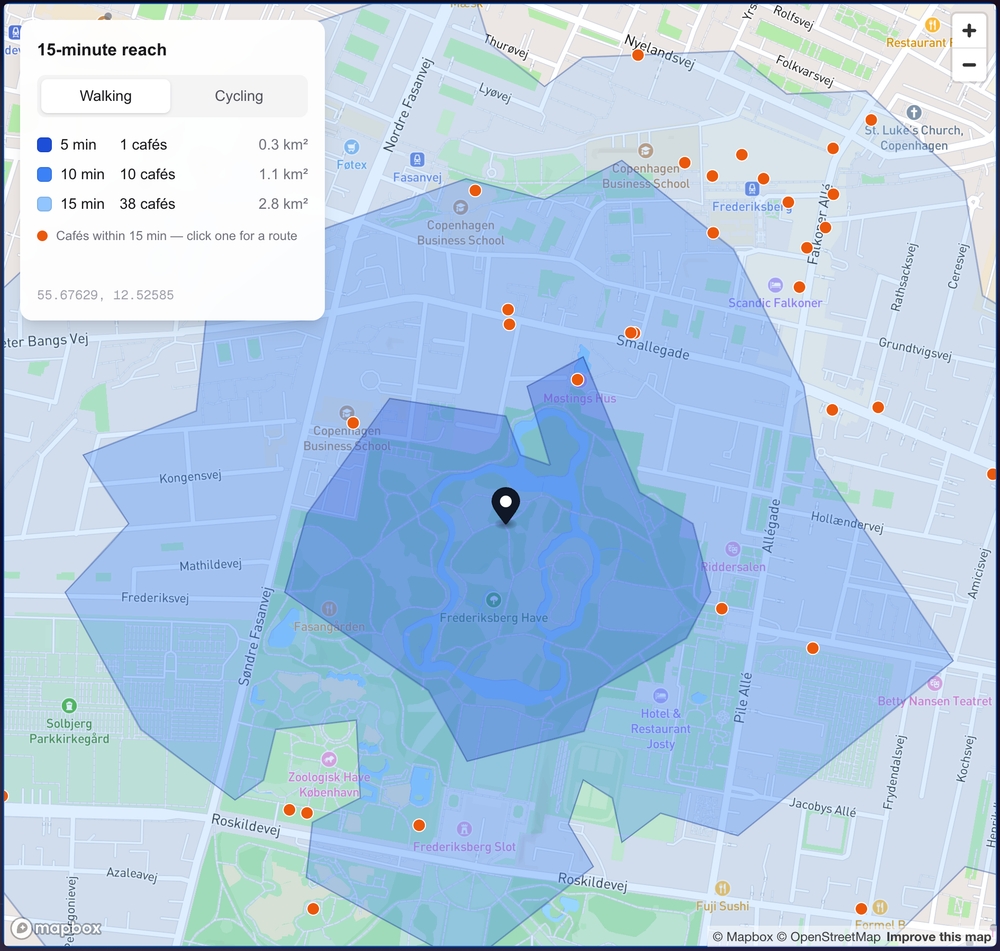
Coffee Reach is a small Mapbox prototype I built. You click a point in Copenhagen, and the map shows how far you can walk in 5, 10 and 15 minutes and which cafés sit inside that area. The easiest way to explain it is with a story.
Demo url: https://coffee-reach.vercel.app/
The story
I meet some people in the city who are visiting Copenhagen. I bring them to Frederiksberg Have, and we walk around the lakes. After a while everyone wants coffee. The question is simple: which cafés are within walking distance from where we are standing?
I open the prototype. It starts with a plain map of Frederiksberg and one instruction: click the map to choose a starting point.
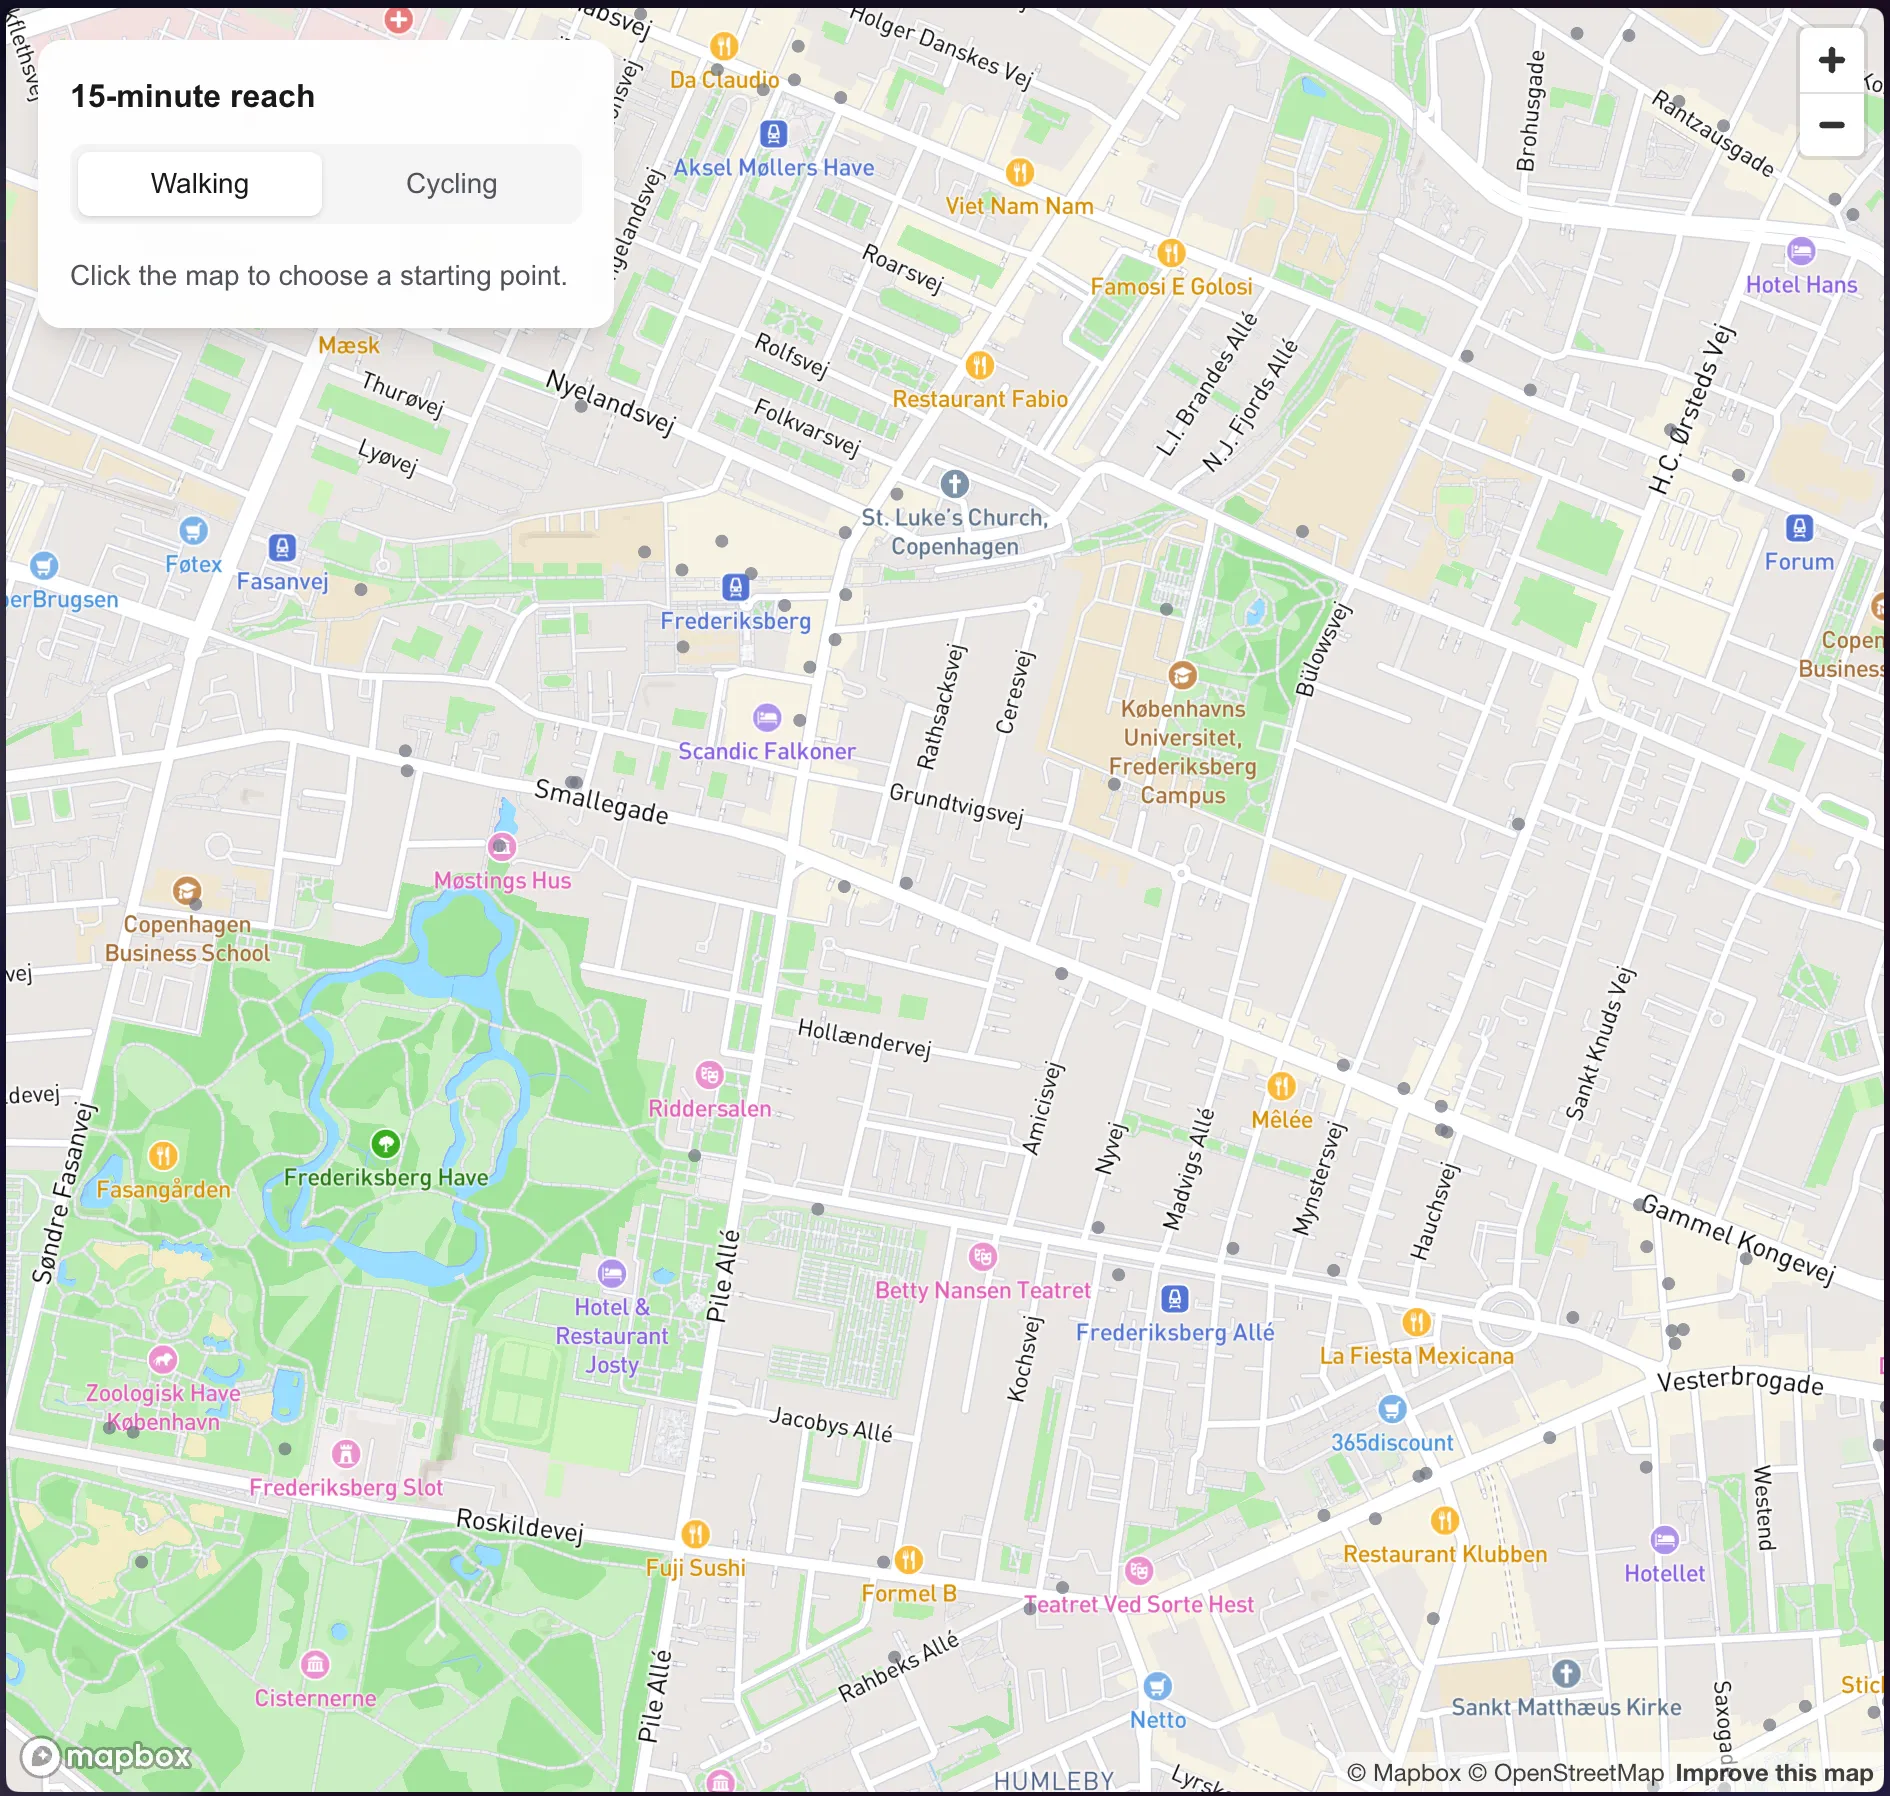
Step 1: click on the map
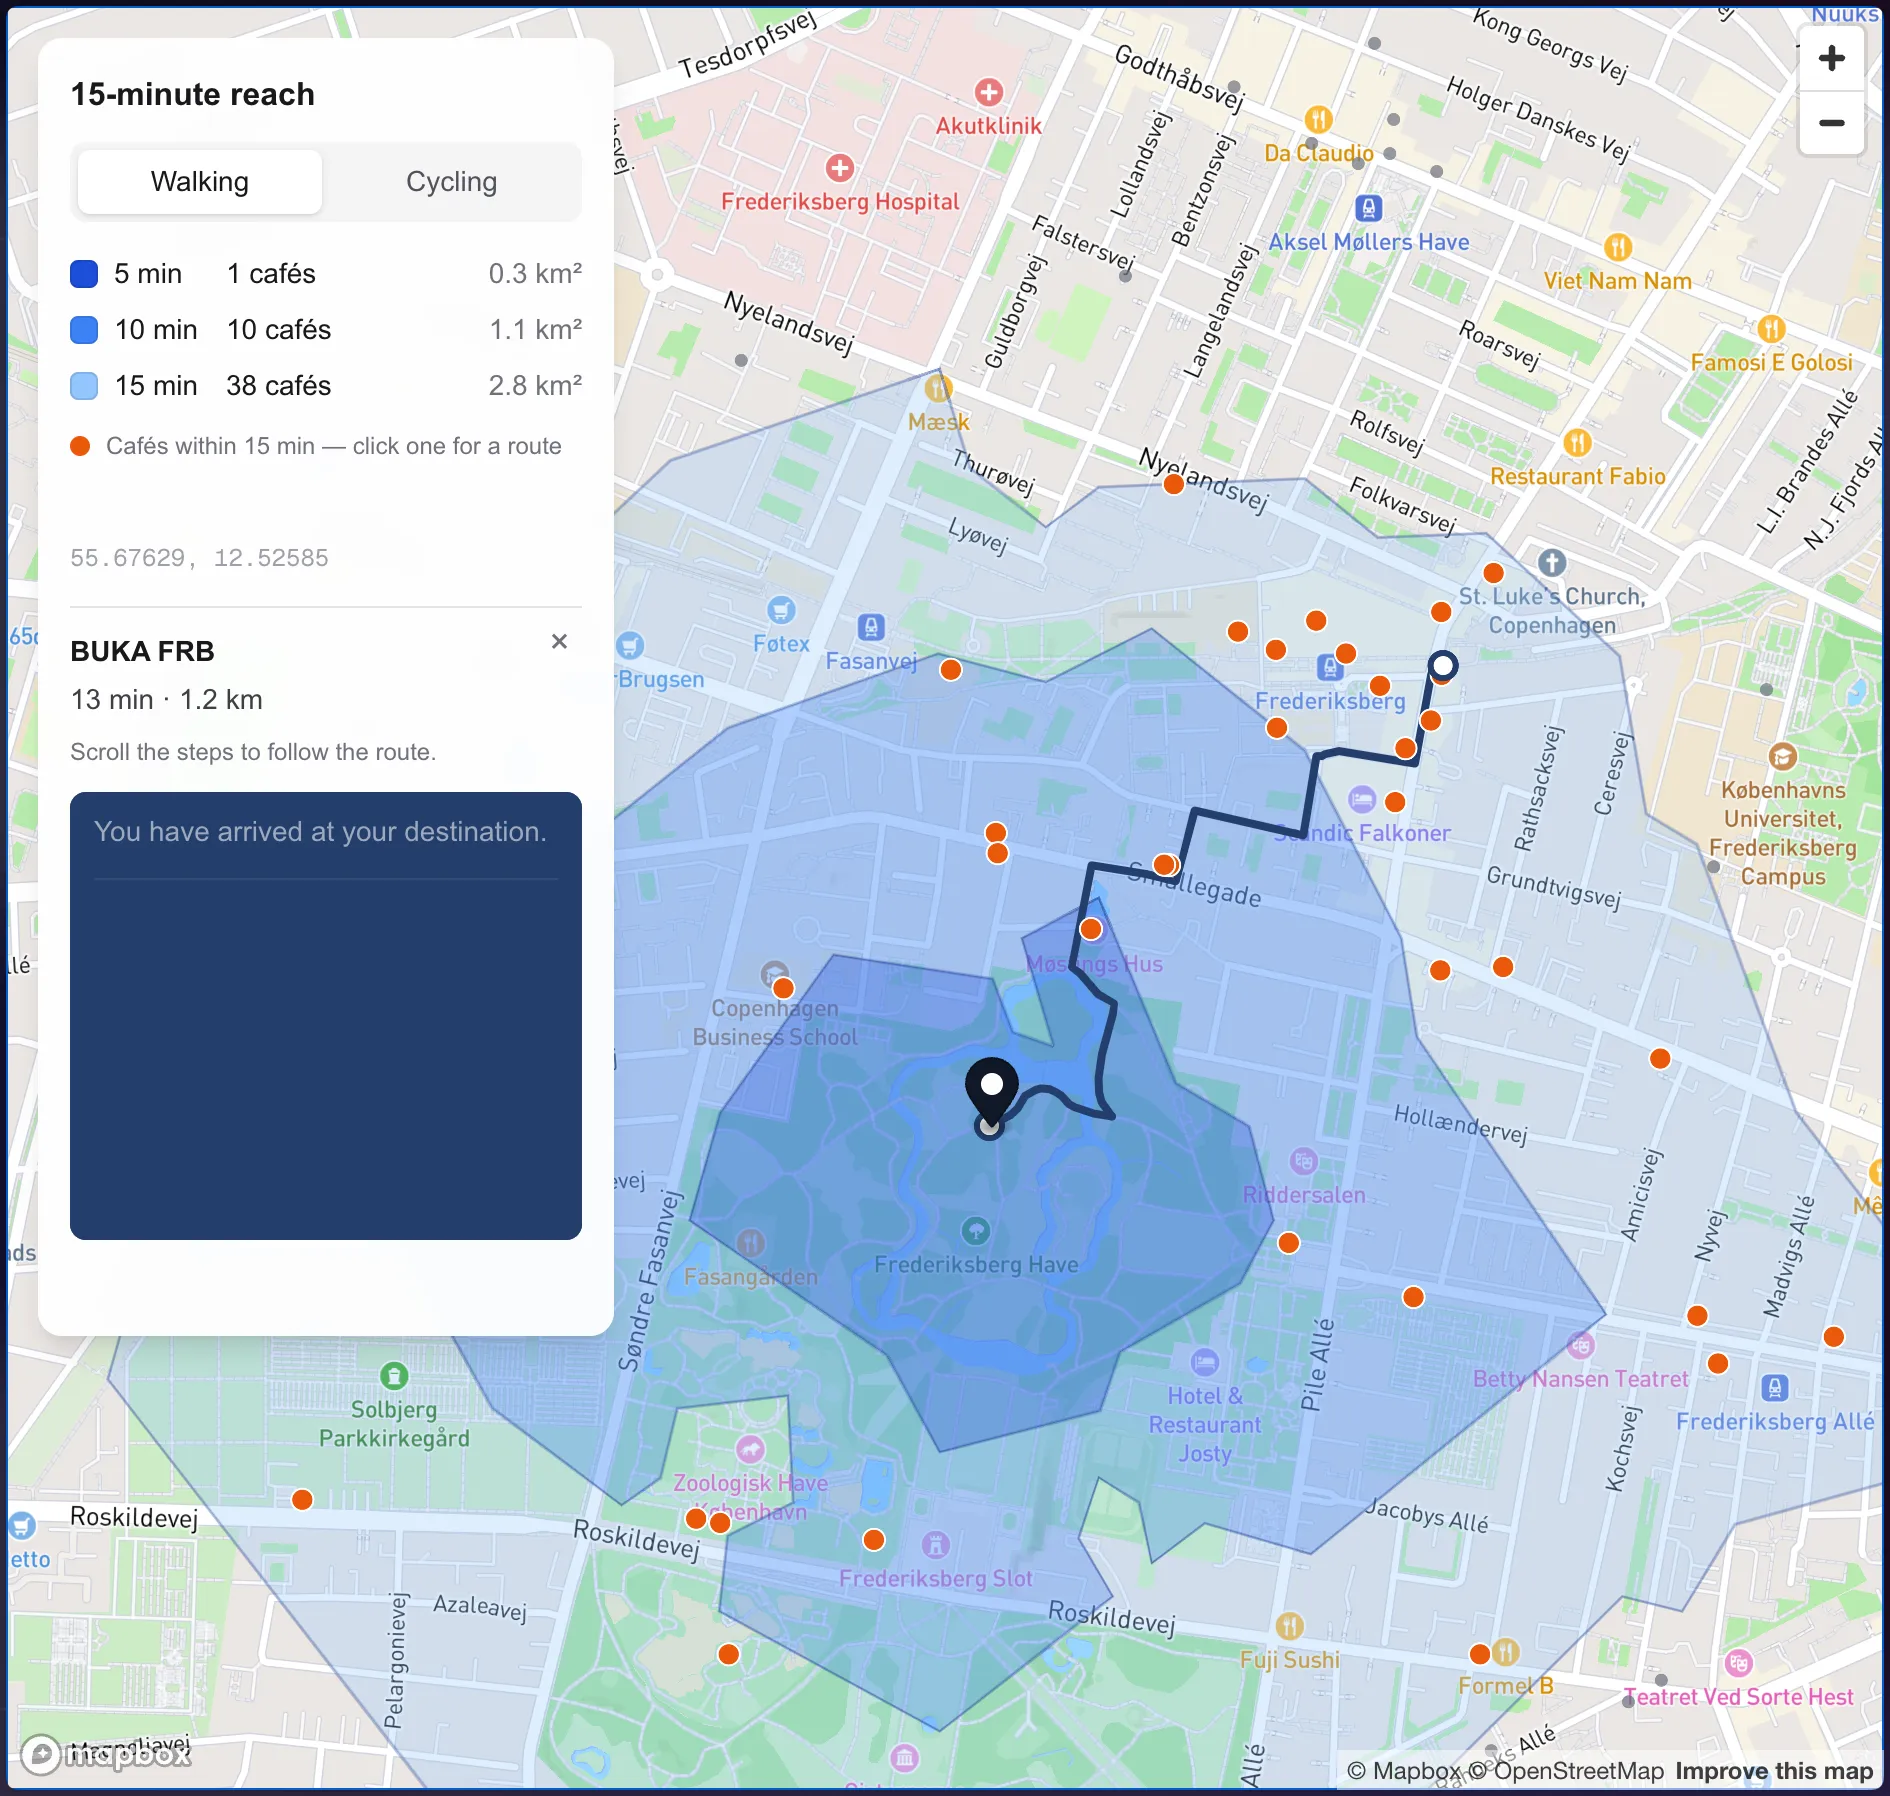
I click on the spot where we are standing, in the middle of the park. The map draws three zones around the pin: 5, 10 and 15 minutes on foot. Every orange dot is a café.
The panel gives the numbers. From the middle of the park there is 1 café within 5 minutes, 10 cafés within 10 minutes and 38 cafés within 15 minutes.
The zones follow real paths and streets, so their shape is irregular. The park has only a few gates, and you can see the reach stretching toward them.
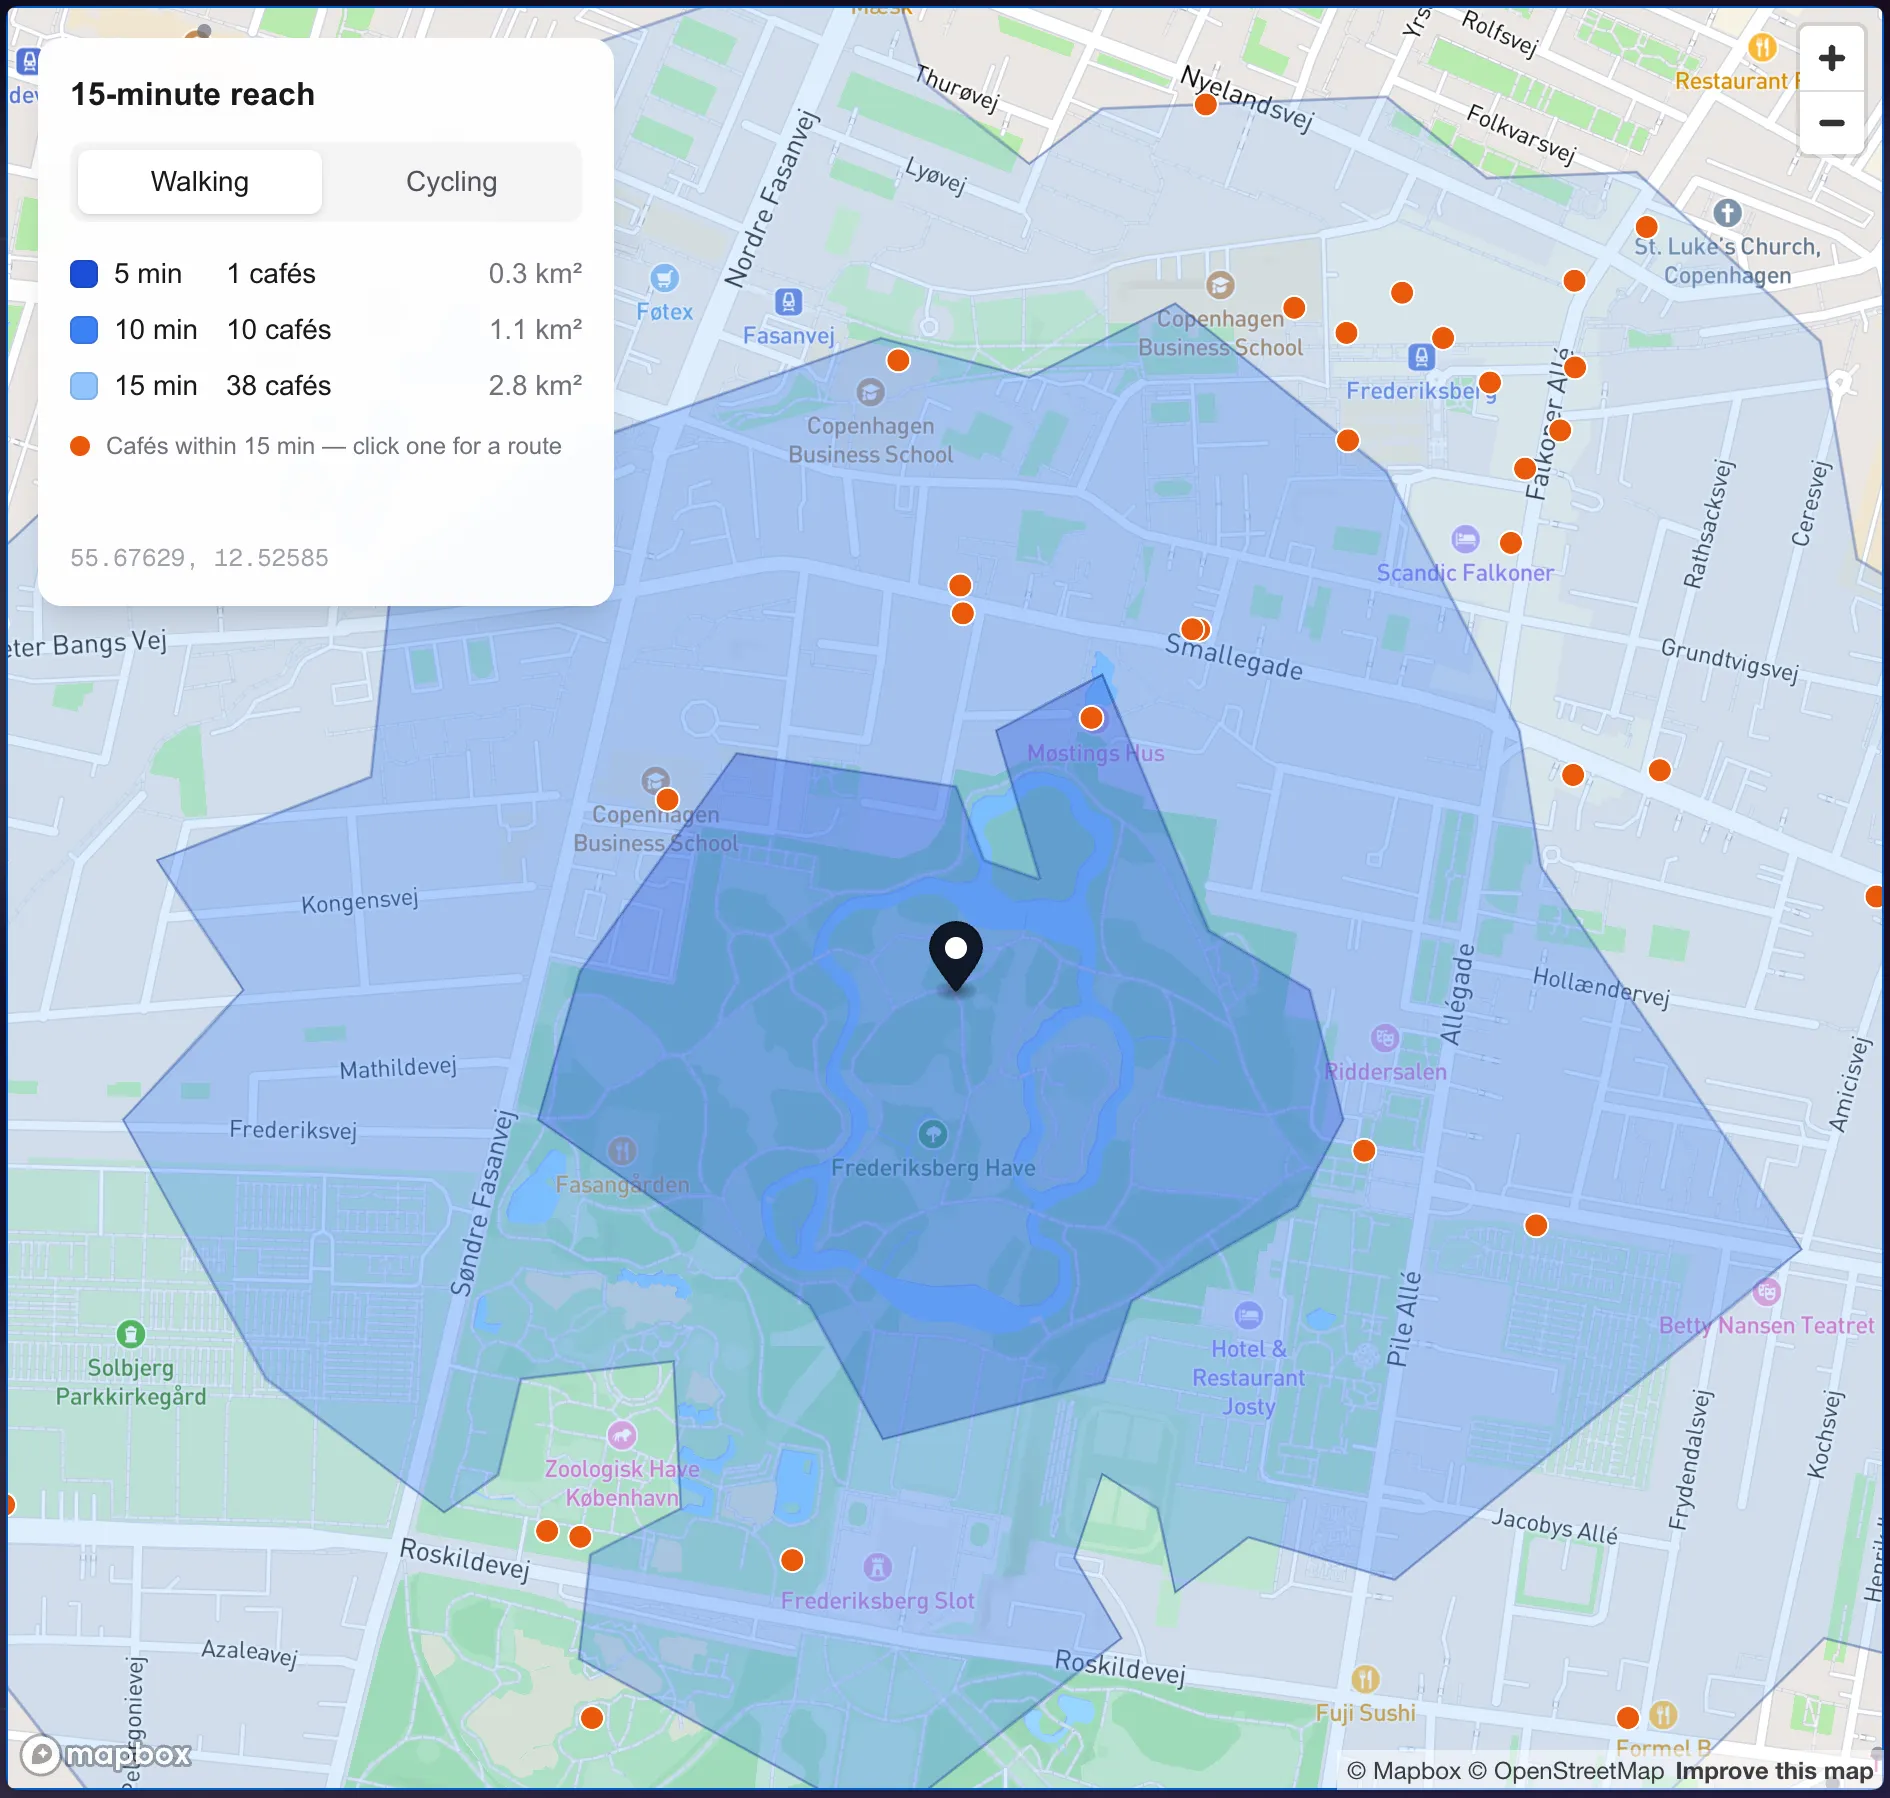
Step 2: click on the desired café
We look at the dots together and choose BUKA FRB, close to Frederiksberg station. I click on its dot. The panel shows the walk: 13 minutes, 1.2 km, and below that a list of steps.
Step 3: scroll inside the route description
This is the part I like most. I scroll inside the route description, and the route draws itself on the map. The line follows the scroll, so each step in the text appears on the map at the same moment.
Halfway through the list we are turning onto Sylows Allé, and the line has reached exactly that corner.
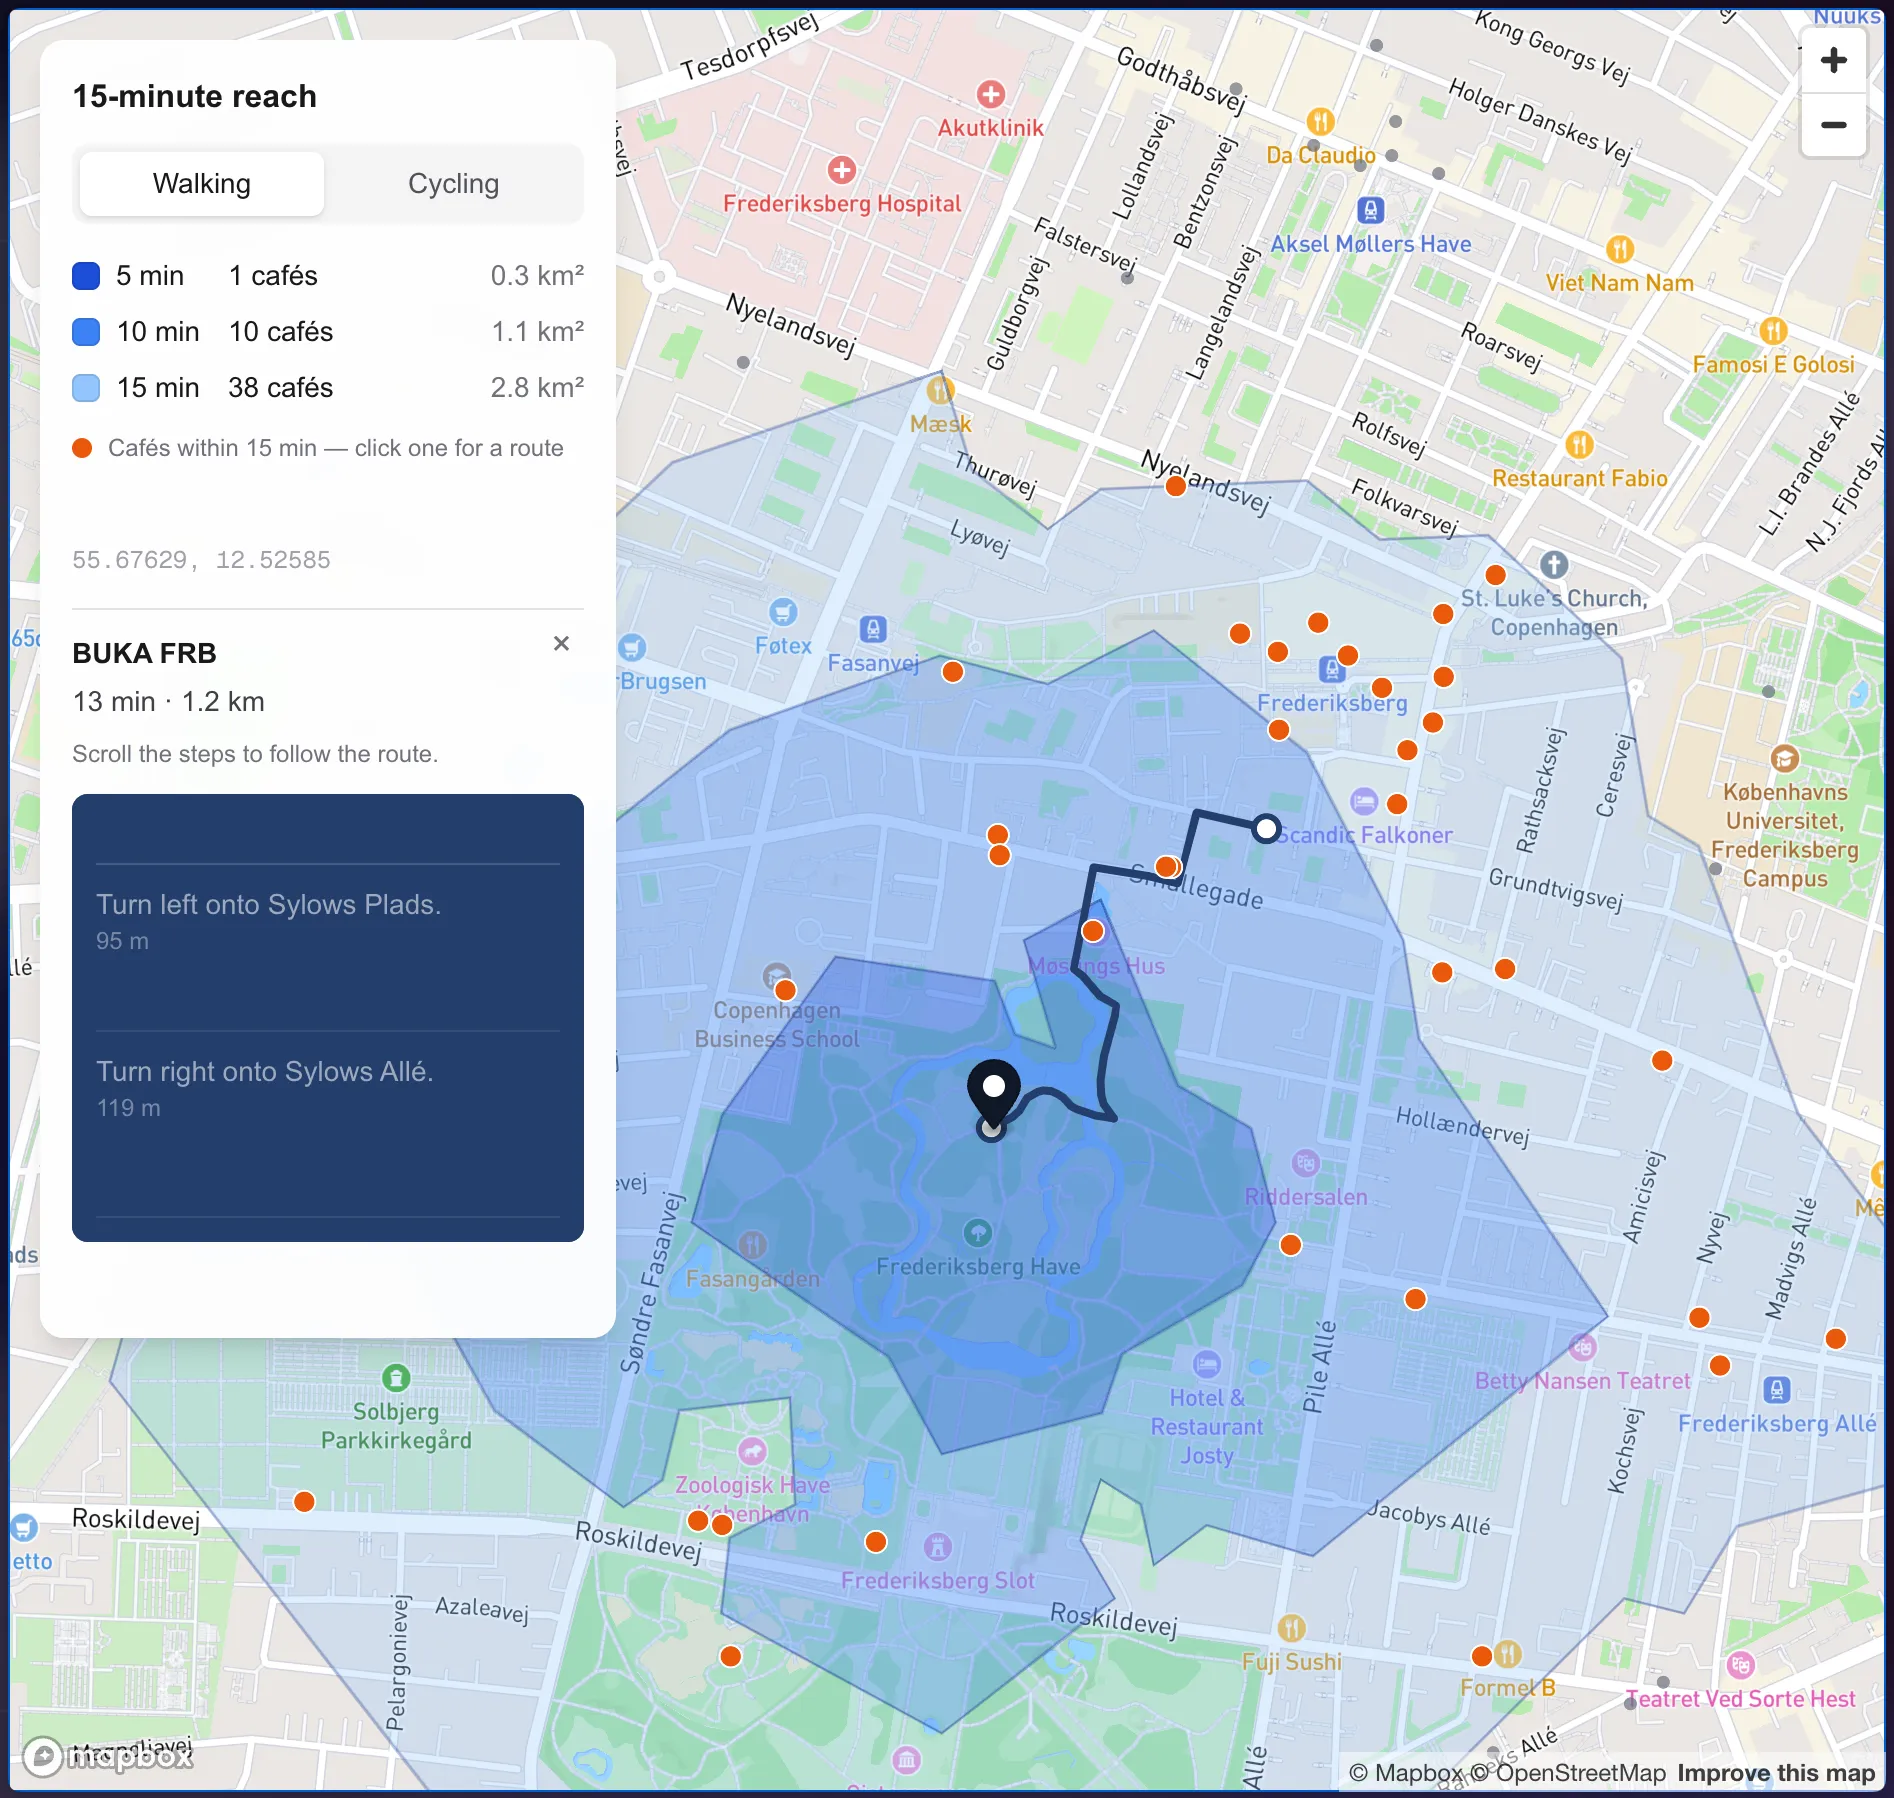
At the end of the list the panel says “You have arrived at your destination”, and the line reaches the café.
Changing the starting point
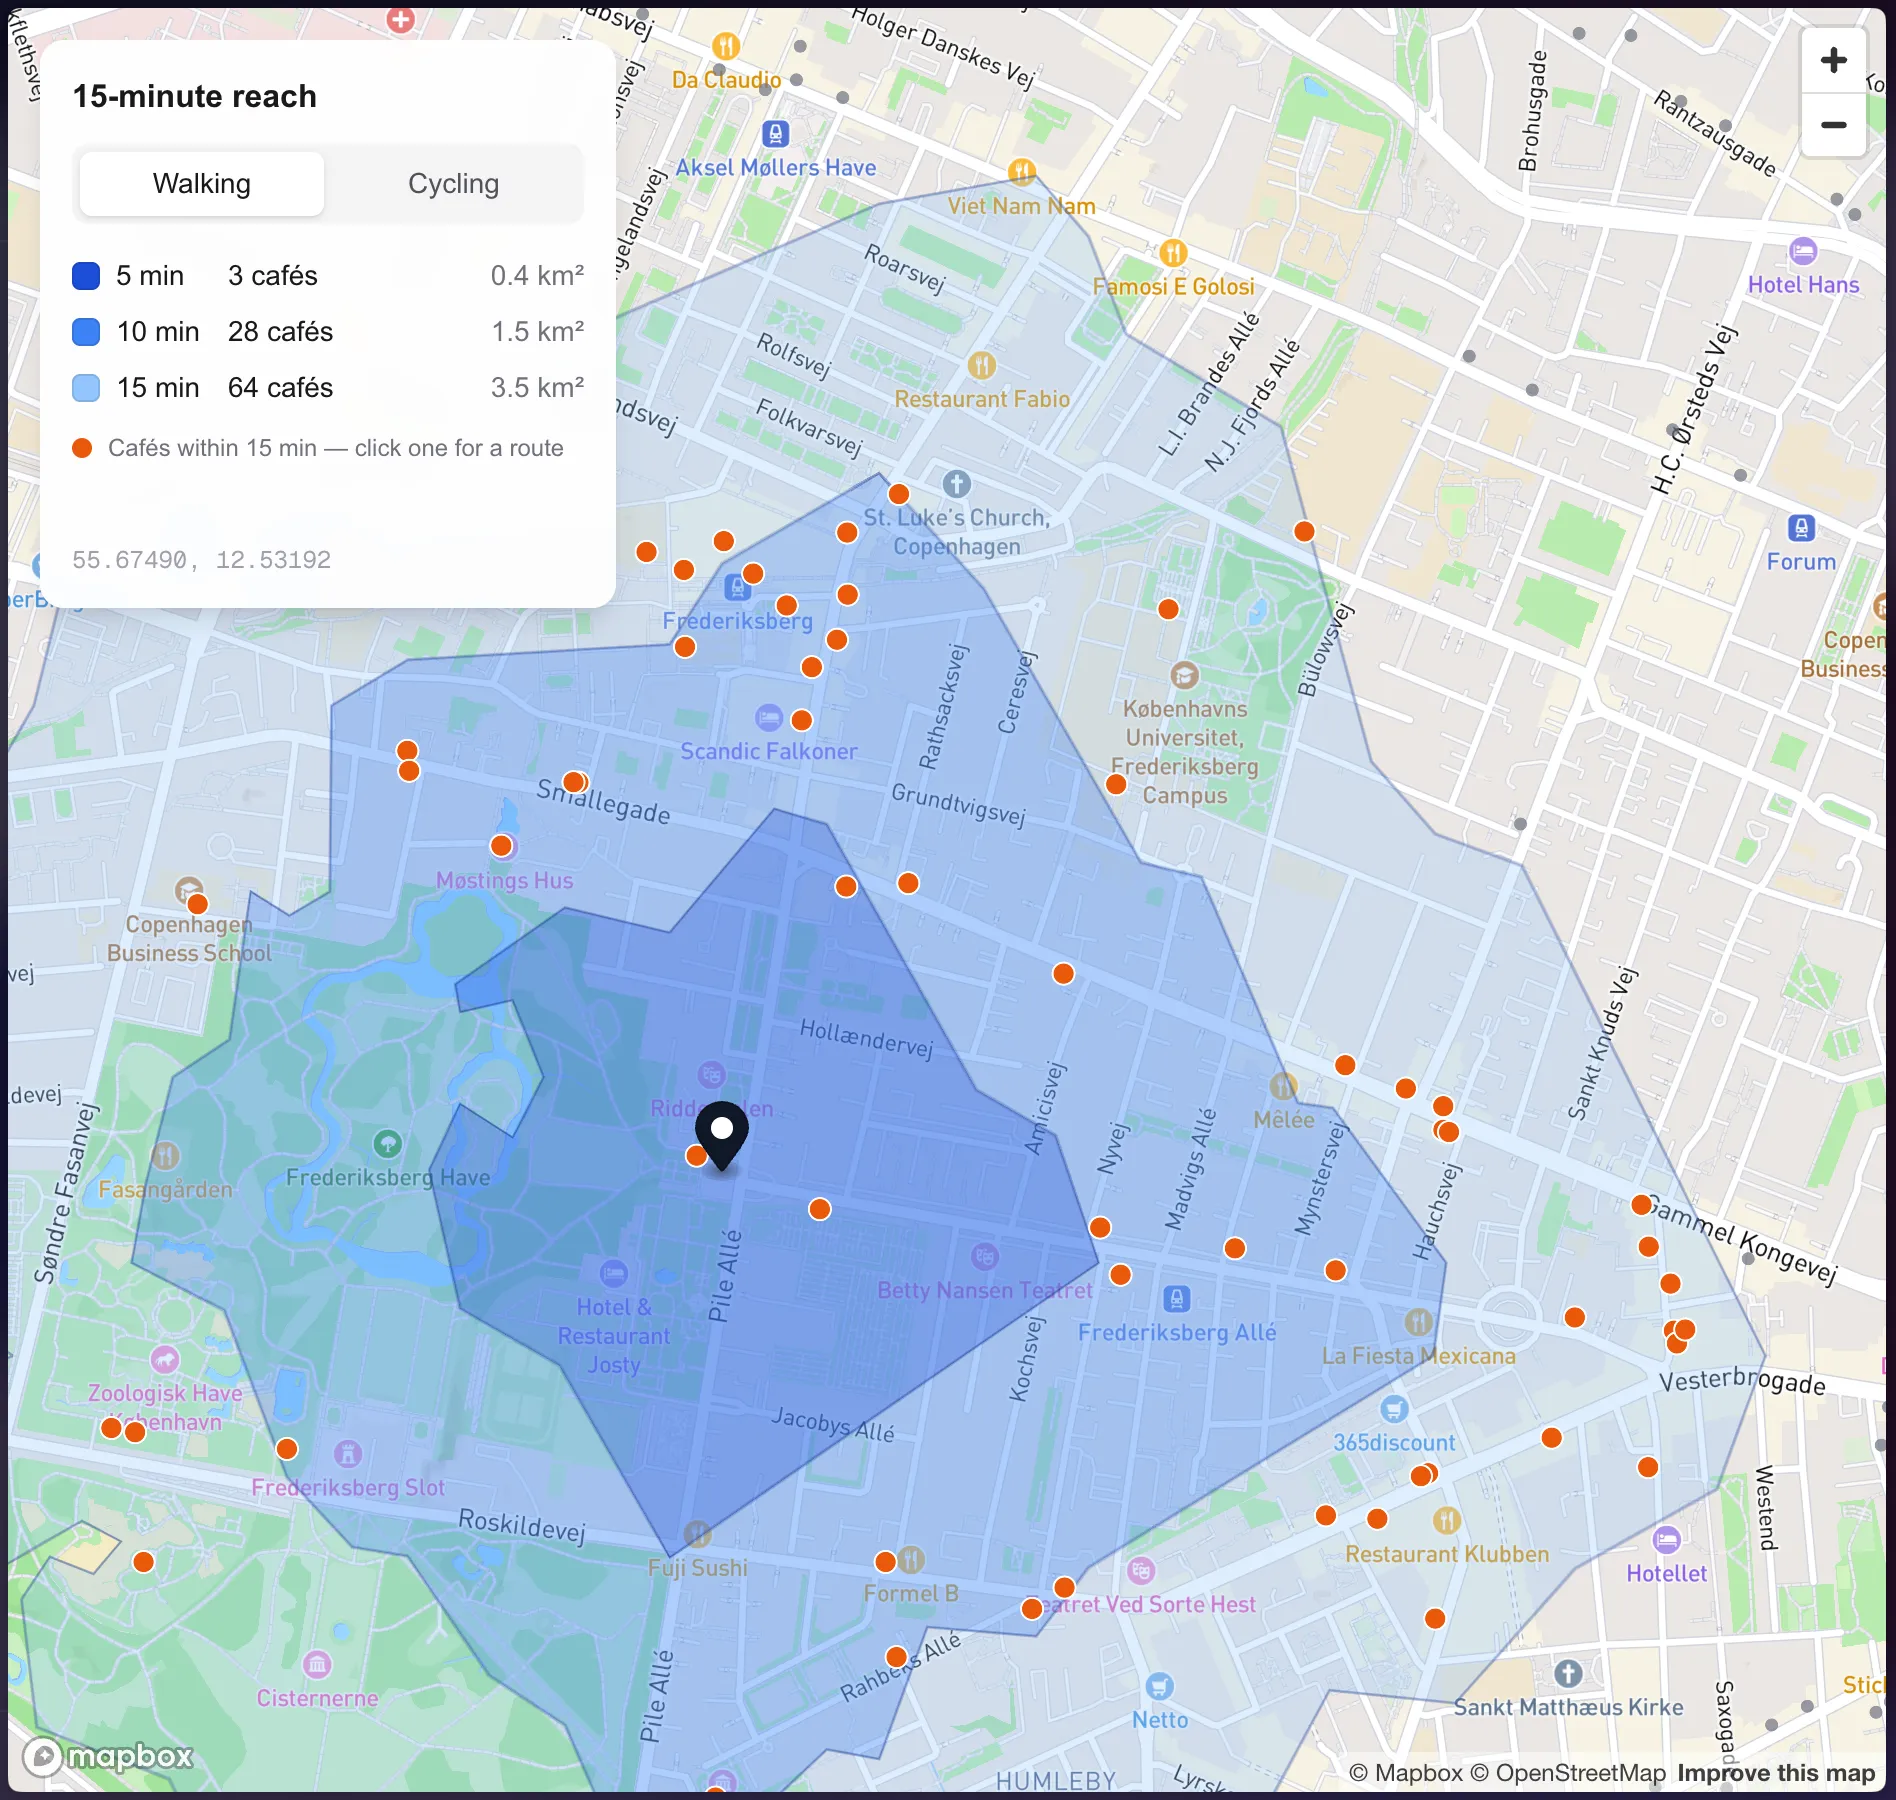
Later we are standing at the park gate on Pile Allé. I click there, and the picture changes. From the gate there are 3 cafés within 5 minutes, 28 within 10 minutes and 64 within 15 minutes. Moving a few hundred meters adds 26 cafés to the 15 minute zone.
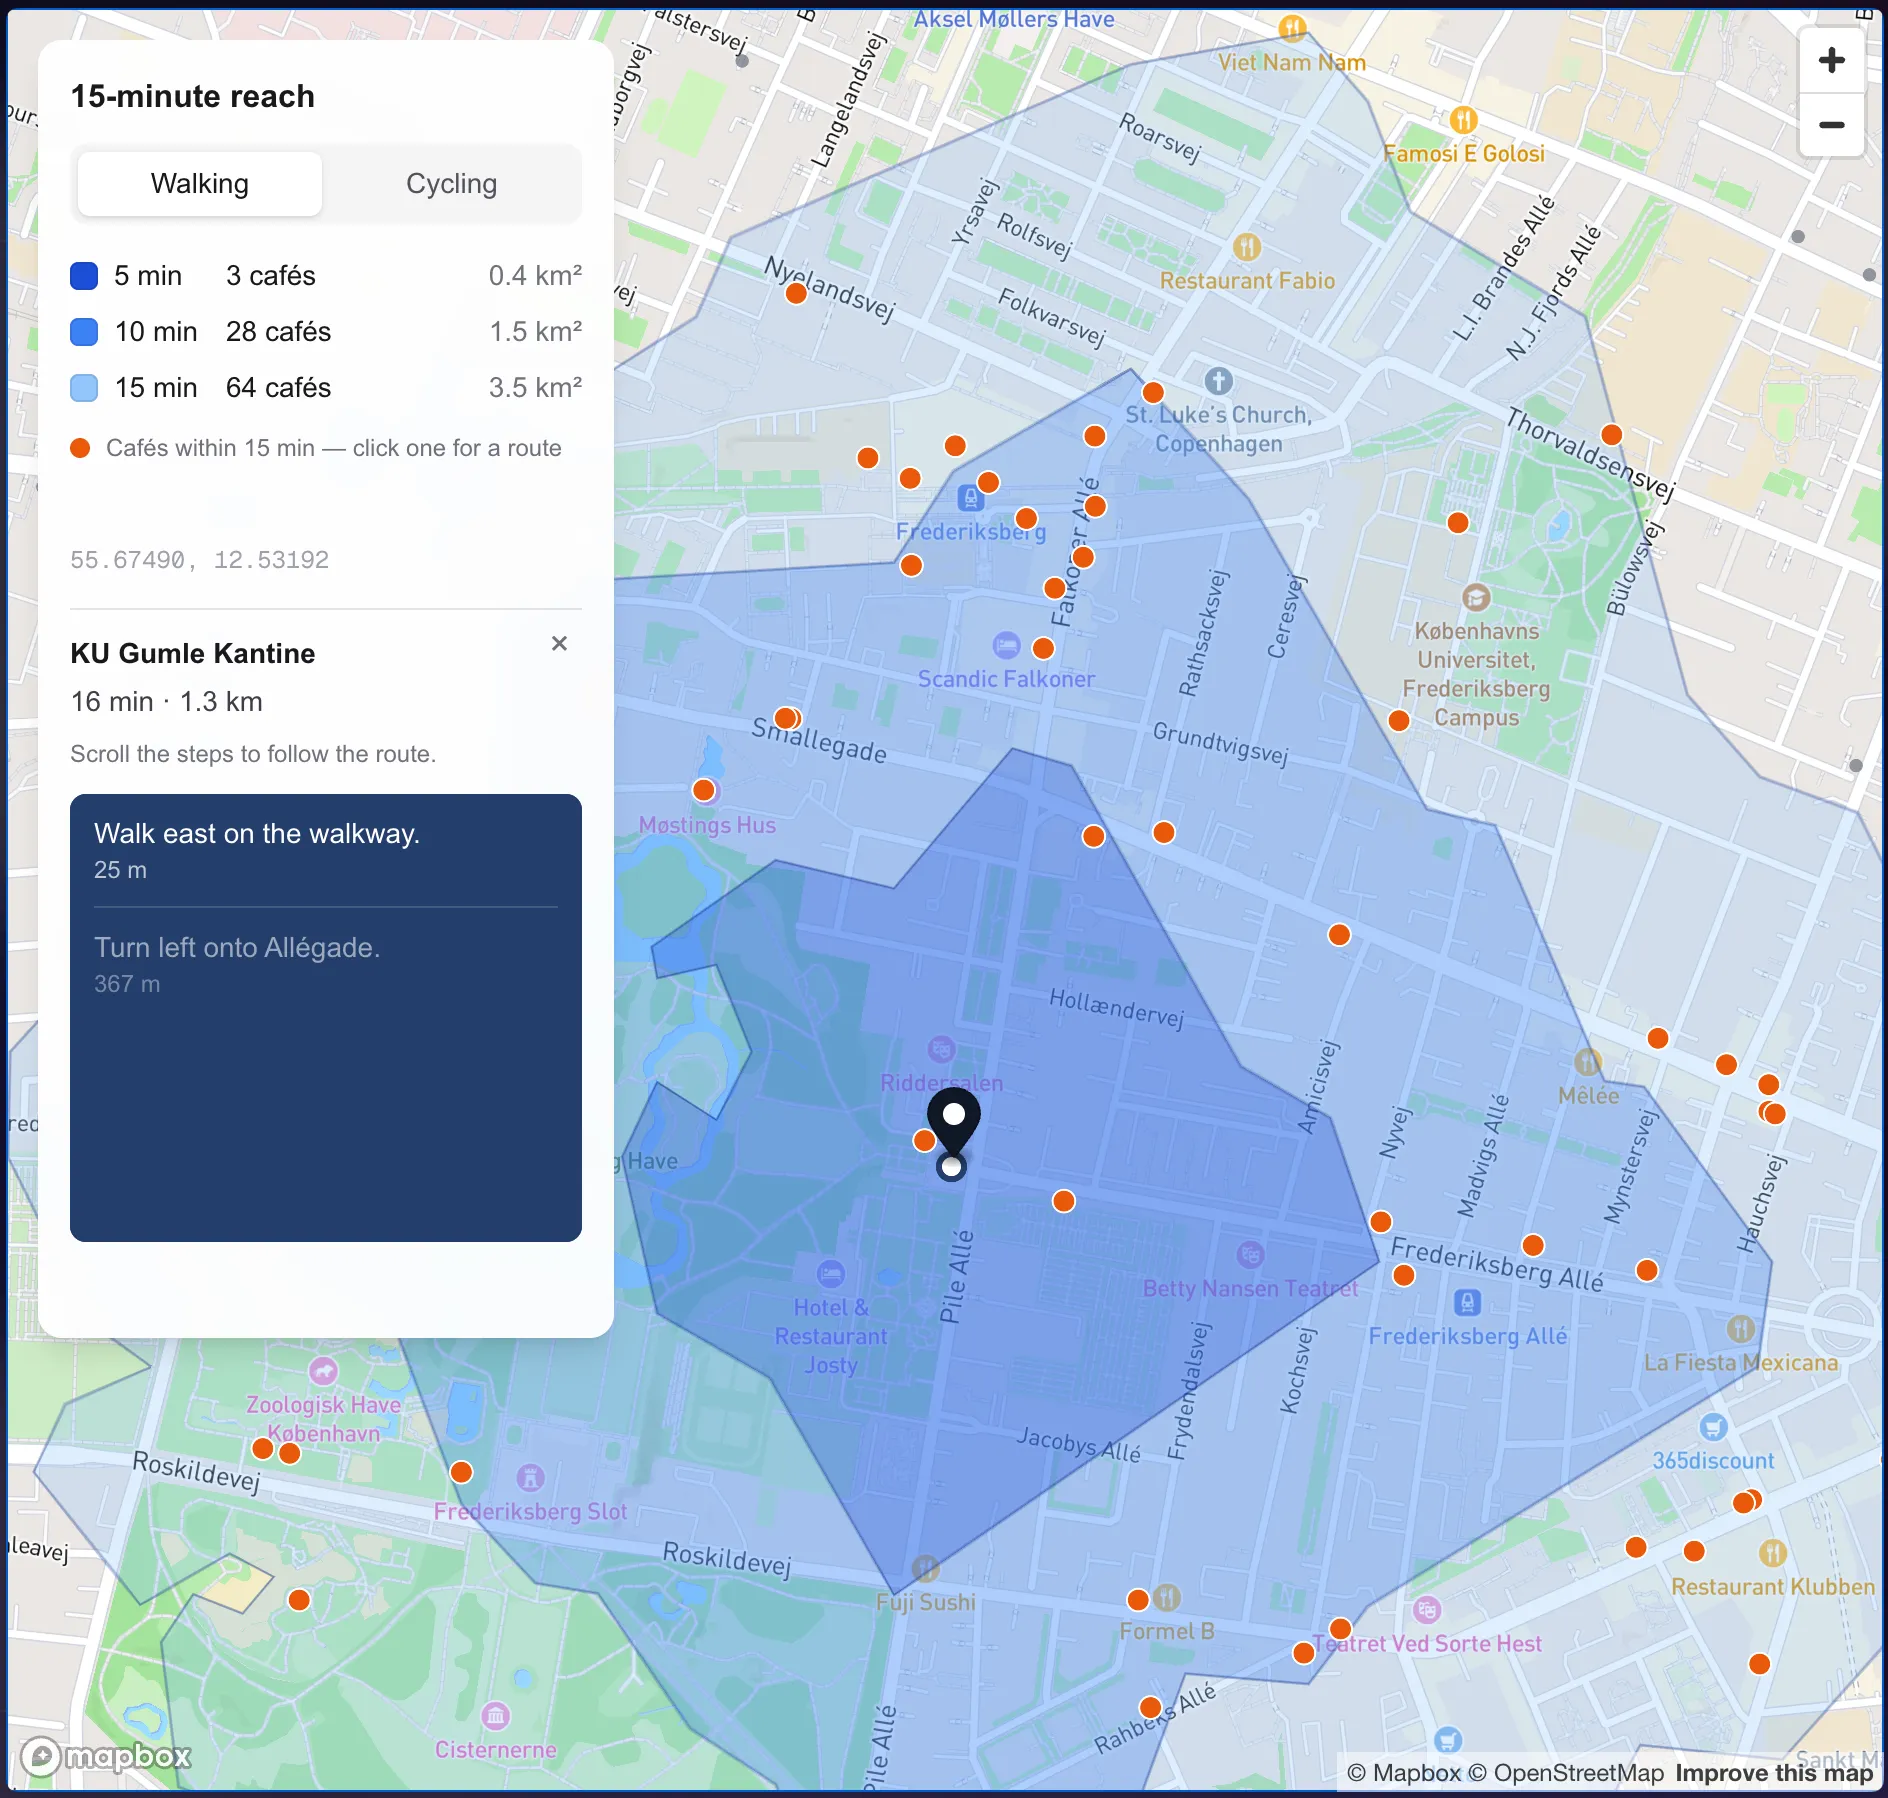
I click on another café, KU Gumle Kantine, and a new route waits at its first step: “Walk east on the walkway”. I scroll, and the walk begins again.
There is also a switch between walking and cycling. The same pin gives a much larger reach on a bike, which is a very Copenhagen way to compare.
An app for storytelling
Coffee Reach is made for storytelling. Navigation stays with the phone apps that are built for it. What this prototype adds is pace. The person who scrolls controls the walk, one step at a time, and the text and the map stay in sync.
That makes it useful when I am explaining a place to someone: a walk through a neighborhood, a guided route for visitors, or an article where the map moves along with the text.
Other uses: service design visualizations
The same pattern works well for service design, where the question is often about reach and journeys:
- How many people can reach a service point in 5, 10 or 15 minutes: a library, a clinic, a pickup point
- How two possible locations compare when you put their zones side by side
- How the reach changes between walking and cycling
- How a customer journey moves through a physical space, shown step by step in a workshop or a presentation
In each case you replace the cafés with your own data, and the scroll becomes the way to walk stakeholders through the journey.
Tech stack
- Next.js with the App Router
- Mapbox GL with react-map-gl for the map
- Mapbox Isochrone API for the walking and cycling zones
- Mapbox Directions API for the routes and the step descriptions
- Turf.js for counting the cafés inside each zone
- Café data from OpenStreetMap: 945 cafés in Copenhagen and Frederiksberg
- Tailwind CSS for the panel
Possible next steps
- Add more place types, such as bakeries, playgrounds or bike repair shops
- Add short notes and photos to the route steps, so the walk becomes a full story
- Let the map camera follow the line while it draws